This article is a list of Unity assets for debugging and troubleshooting. Have you ever found yourself trying to solve the following problems:
- Project size has gotten too big. How to search and delete large unused assets?
- How do you check and change the value of a variable on runtime?
- Is it safe to delete an asset or are there any assets referencing it?
- How to see debug logs on mobile and VR builds?
- How to remove duplicate assets and invalid layers?
- How to quickly fix missing script components on multiple prefabs?
I believe that the asset below can answer these questions above. All of these are free and well-maintained assets except for a few paid assets that are too good to exclude.
Logging
Lunar Console
This is my go-to asset for displaying debug statements on mobile. It’s also easy to enable / disable the logger just by toggling the script. Read the wiki and try the Android demo app to see if this fits your needs.
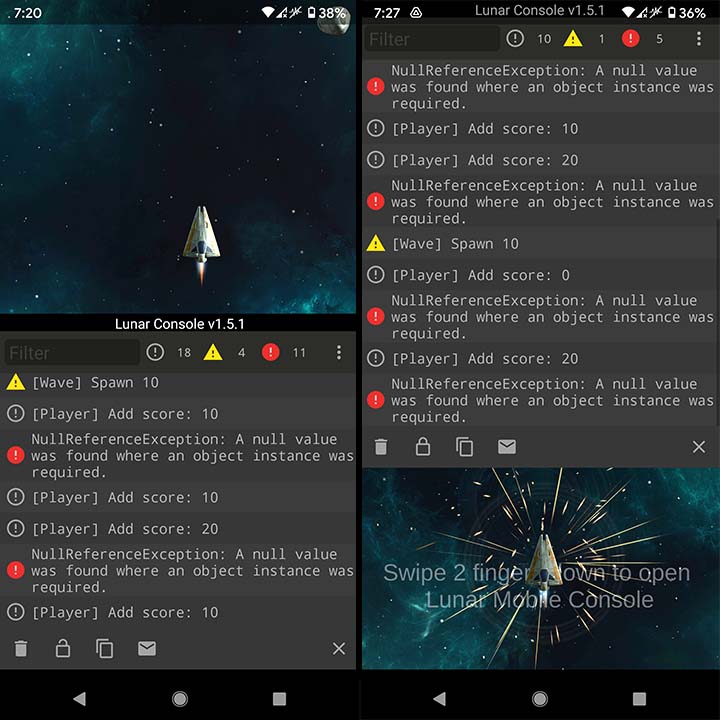
Between the Free vs Pro versions, the only differences are user-defined actions / variables and a transparent log overlay.
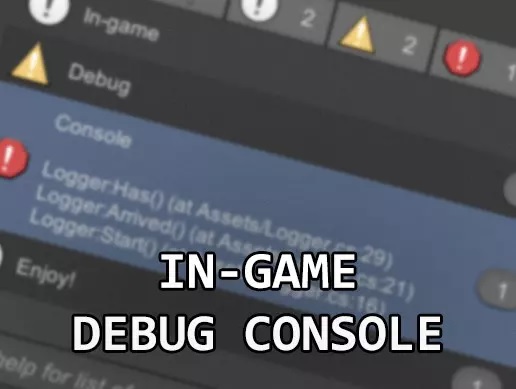
In-game Debug Console
Similar to Lunar Console. This asset helps you see debug messages (logs, warnings, errors, exceptions) runtime in a build (also assertions in editor) and execute commands using its built-in console. It also supports logging logcat messages to the console on Android platform.
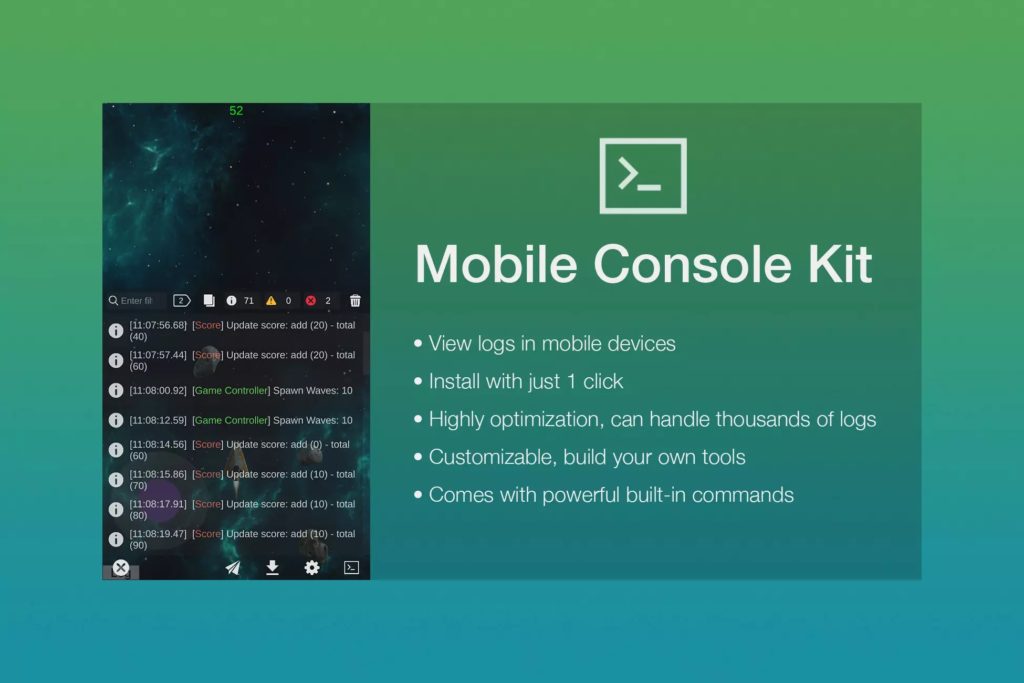
Mobile Console Kit
This asset allows you to view logs on your mobile device and share these logs via Native Share. Another useful feature is the ability to change variable values during runtime.
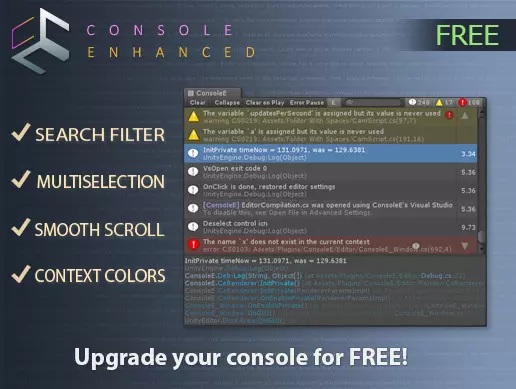
Console Enhanced Free
An improved replacement of the Unity Editor Console. This asset does not introduce a feature that the Editor console does not have. It simply improves the console user experience by a lot.
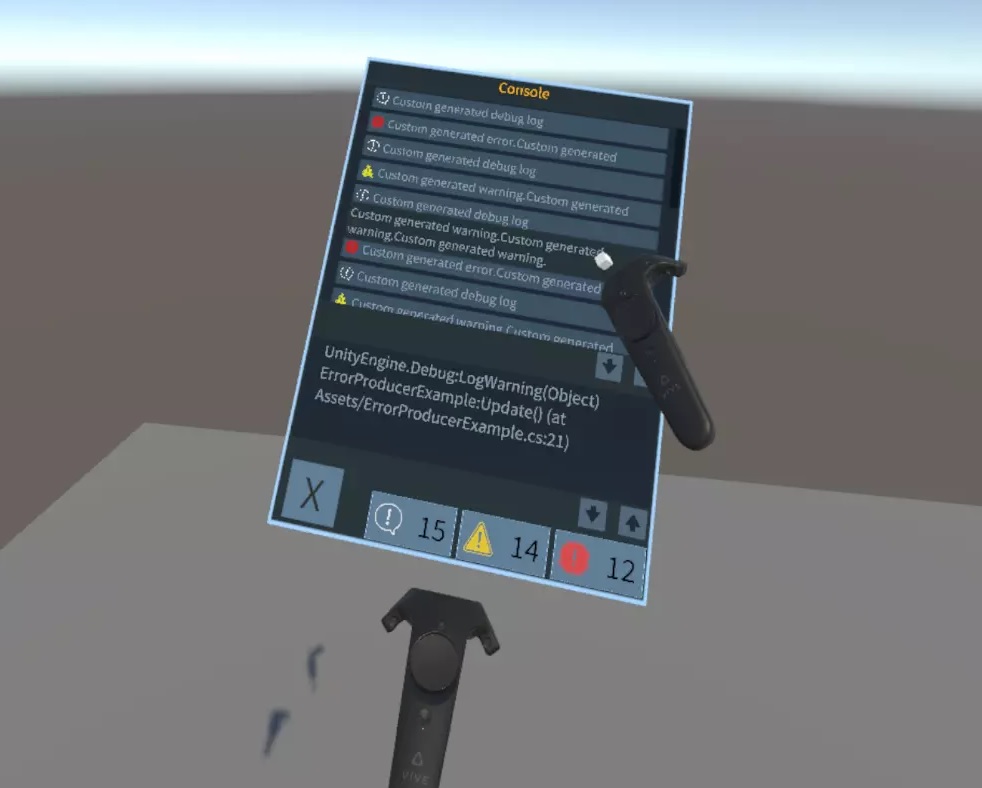
VR Console (Paid)
Displays the debug console while in VR. Very helpful when troubleshooting Quest 2 apps.
Remote Debugging
Remote Inspector – Android & iOS
If you’re a mobile developer, you know how tedious it gets when debugging. You need to make a new build and install it to your phone every time you want to make a small change. Remote Inspector helps alleviate the pain. It allows you to change values in the Unity Editor and immediately see the effects in your mobile app during runtime.
Native Android Debugger MT
This asset is a tool that runs in the Editor and helps you debug your Android device over Wi-Fi. It also allows you to send your Builds to your device without a USB cable.

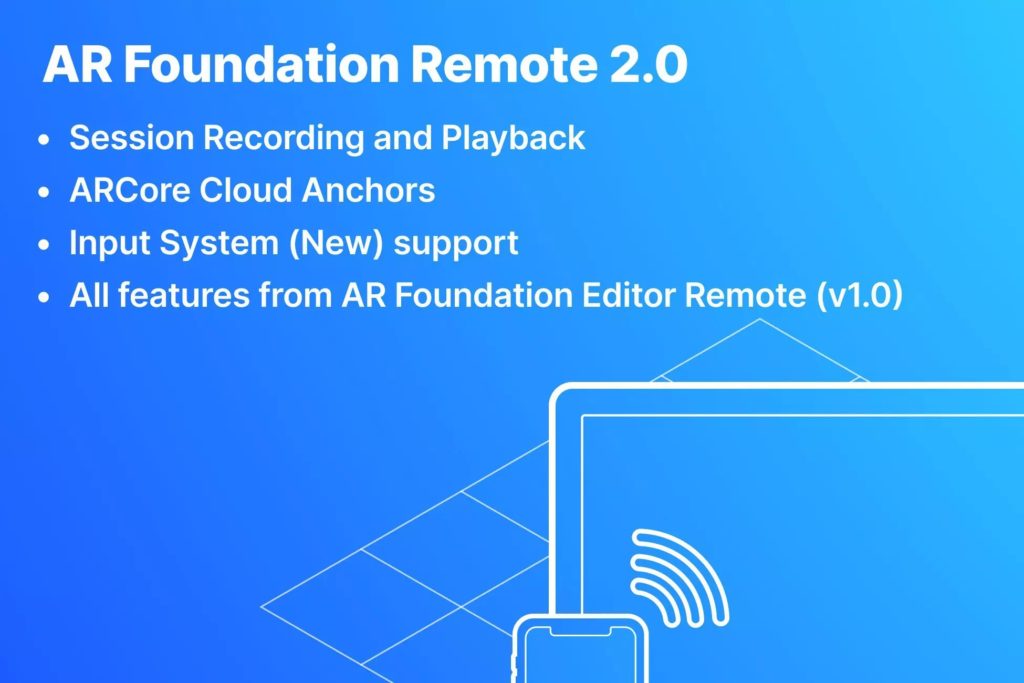
AR Foundation Remote 2.0 (Paid)
This asset is a paid asset. Debugging augmented reality apps take a lot of time because you often need to test certain items that require mobile-only features such as the camera and location services. This tool allows you to iterate faster with AR projects.
Profiling, Optimization, and Cleanup
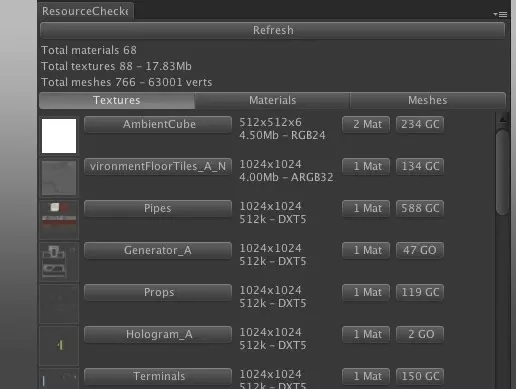
Resource Checker
Resource checker helps you determine how much resources certain assets are using. You’ll want to use this tool during optimization to identify which scene assets to trim first.
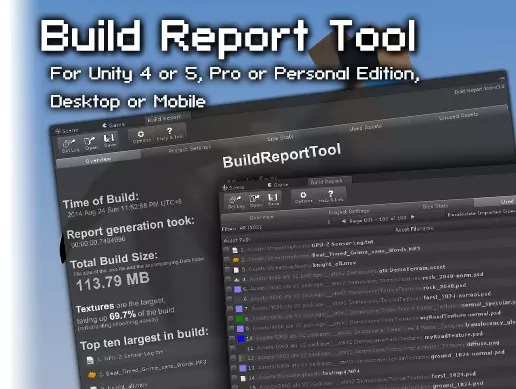
Build Report Tool (Paid)
A handy tool to use to reduce your build size. Features include the following:
- understand why certain assets are included in the build
- detect unused assets
- save build reports to XML
- see what project settings were used to create a certain build
- see what DLLs are getting included in the build
Dependency Management
One tool that I wish Unity had by default is a reference viewer window. A tool like this should allow you to click on any asset in the Project or Hierarchy window and identify the assets it references as well as show all the assets that depend on it. This is an important tool when you are trying to decouple assets and update/delete old ones. This is extremely important when working with multiple people through version control. You want to everybody to work on the same project and minimize merge conflicts as much as possible.
Found inside the right-click menu, I find Unity’s built-in dependency viewer tools to be lacking. First is the Find References in Scene tool. I’ve encountered multiple instances where this tool did not work as expected. Second is the Select Dependencies tool. This one does not offer you control on how far down the dependency tree you want to go. You always end up selecting everything.
Asset Usage Detector
This tool helps you find usages of the selected asset(s) and/or Object(s) in your Unity project, i.e. lists the objects that refer to them.
- You can search usages of any object that extends UnityEngine.Object
- Extensive search algorithm that uses SerializedObject and reflection to find references
- Can search in multiple scenes at once
- Also works in Play mode
NG Missing Script Recovery
This tool looks for broken Components in all prefabs in the project and also searches for Scenes with broken Components. This can be a total life saver when trying to update, fix, and merge Unity projects.
Asset Hunter Pro (Paid)
Asset Hunter PRO finds unused or duplicate assets in the project, and gives you the overview to easily delete them. You will also be given an overview over how your assets references each other with a feature called Dependency Graph. It even offers a one-button clean up of the entire project.